XAUUSD research · education · resultsFor information and knowledge sharing only. Not investment advice.
AURUM Intelligence
AURUM INTELLIGENCE
XAUUSD · DAILY RESEARCH
ISSUE No. 13XAUUSD DAILYFRIDAY 23 OCTOBER 2026 · 08:12 BST
Daily gold research · London morning

Daily XAUUSD market intelligence, framed by risk before return.

One disciplined note each weekday morning: the rates and dollar backdrop, the prevailing market structure, and the levels that matter.

XAUUSD
$4,015.26
spot · 08:12 BST · −0.27%
DXY
101.70
Thu close 101.61
UST 2Y / 10Y
4.65% / 4.96%
CMT · 22 Oct
Catalyst
Weekly close
Fri · FOMC 27–28 Oct
I

Latest daily note

Friday 23 October 2026 · Issue No. 13
Lead story · key takeaway

Gold loses 2.6% to test $4,000 as forced selling beats falling yields

Gold fell about $108 on Thursday to close near $4,026, its lowest in more than two weeks. Asia briefly broke $4,000 with a low of $3,988 at 03:00 UK, and spot now sits at $4,015, with $4,021 and $4,032 the first caps.
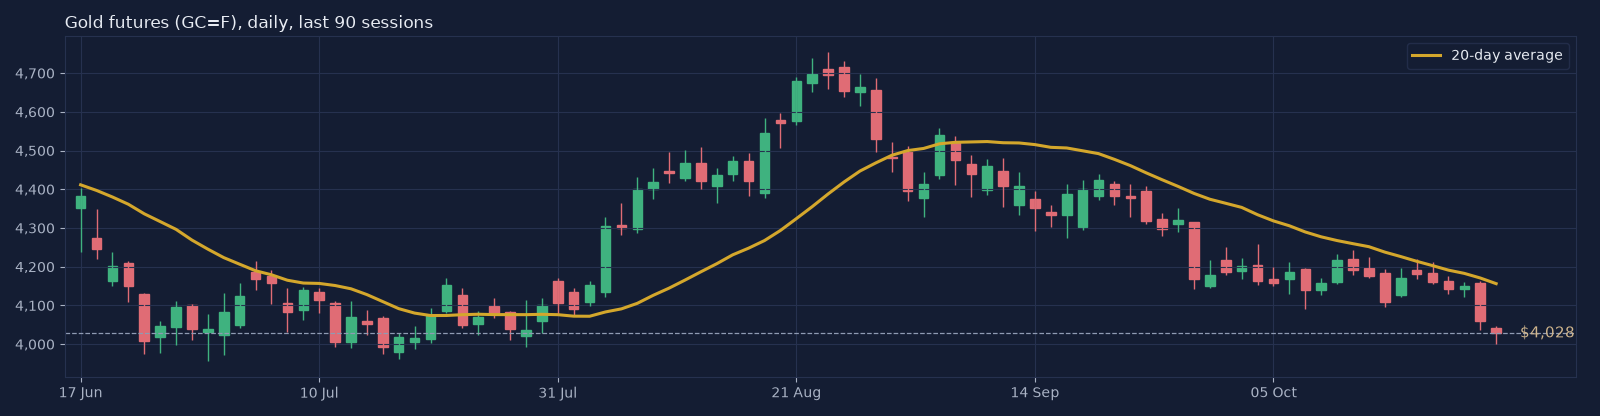
GC=F daily candlestick chart
Chart: gold futures GC=F daily candles with 20-day average (Yahoo Finance data, plotted 08:12 BST, 23 Oct 2026). Futures trade at a premium to spot, so chart levels differ from the spot strip.
BackdropYields fell hard on Thursday, yet gold still dropped: selling for cash during the tech sell-off outweighed the rate relief.
Market structureThe October lows near $4,068 have given way, and the first test of $4,000 has held only just. Today’s working range: $3,985–$4,040. Nearest resistance $4,021, nearest support $4,002; full ladder alongside.
Download PDF ↓Open PDF2 pages · navy & gold edition
II

Live chart

XAUUSD · spot · TradingView

Chart and data provided by TradingView (OANDA:XAUUSD); prices may differ slightly from your broker’s feed. Daily levels are drawn in the research note, not on the live chart.

III

Research archive

every weekday note, with PDF
Full archive →
IV

Indicators

published on the MQL5 Market
Screenshot coming soon
Indicator 1 · MQL5 · MetaTrader 5

Line Alert Snap

Key levels & lines

Horizontal price lines for the levels that frame the gold session: support and resistance, the previous day high and low (PDH/PDL), and market session opens and closes. Lines can be placed on swing high and low clusters and alert when price crosses them. An educational tool for marking and studying key levels.

View on MQL5 Market ↗
Screenshot coming soon
Indicator 2 · MQL5 · MetaTrader 5

Aurum SMC signal XAUUSD

Smart Money Concepts with confluence

Maps the components of Smart Money Concepts on the chart: market structure (BOS and CHoCH), order blocks, supply and demand, fair value gaps, liquidity pools and premium/discount ranges, so you can study where several of them line up in confluence. Calculated on closed bars.

View on MQL5 Market ↗
Screenshot coming soon
Indicator 3 · MQL5 · MetaTrader 5

AURUM Liquidity Retest

SMC liquidity & retest

Follows one SMC sequence step by step: buy-side and sell-side liquidity levels, the sweep of a level, the change of character (CHoCH) that follows, and the retest of the broken level. Built to help you learn to recognise each stage as it forms.

View on MQL5 Market ↗

Indicators are analytical tools. They display information and do not guarantee profits; no performance claims are made.

Results · from 26 October 2026

One account, reported in full at the New York close.

A single published account with its equity curve, trading statistics and monthly returns. Figures net of costs, losing periods included, derived from broker statements.

View results →
AccountOne · to be confirmed
UpdatedDaily, NY close
BasisNet of costs
V

Join

free daily note · Telegram

The daily note, in your inbox before London opens.

Free. One email each weekday. Unsubscribe at any time.

Email sign-up opening soon

We will use your email only to send the research. No tracking, no third-party sharing.

Telegram

Daily notes, levels and weekend updates on the AURUM Intelligence Telegram channel.

Follow on Telegram ↗
VI

About

AURUM Intelligence is written by a markets practitioner with senior institutional risk-management experience across trading and portfolio risk. The research applies that discipline to gold: define the market structure, state the levels, and set out in advance what would change the picture.